
A policyholder depends on an insurer being able to pay claims years after a policy is purchased, so financial strength matters beyond a company’s size or visibility. Our assessment process helps us judge whether an insurer can meet those obligations as risks and business conditions change.
We connect financial results with the risks behind them, the capital available to absorb losses, and the actions management can take. A large insurer is not automatically more able to pay claims than a smaller one. Size offers context, but it does not replace a close look at financial resilience.
We can use the same approach to support decisions about growth, pricing, reinsurance, and other business plans. Each assessment should fit the insurer’s products, structure, and risk profile. We can make the assessment useful by connecting each material exposure to the resources and actions available to address it.
Key Takeaways
- Solvency is an insurer’s continuing ability to meet obligations.
- Risk-based capital (RBC) links required capital to the risks an insurer faces.
- Own Risk and Solvency Assessment (ORSA) looks at current and future risks.
- Risk categories can interact, so combined effects matter.
- Capital ratios need context and do not show every company-specific exposure.
- Company rankings by premium volume are not solvency ratings.
What Is Insurance Solvency Risk Assessment?
An insurer is solvent when its financial resources support its obligations to policyholders as they come due. In practice, we assess whether the company can pay claims and other debts while its risks and capital needs change.
A current financial position is a view of the insurer at a particular time. A forward-looking solvency assessment asks whether resources can continue to support obligations under expected and adverse conditions. The difference matters because an insurer can be solvent today yet face pressure later.
For example, new claims, investment losses, or rapid business growth may change the amount of capital the insurer needs. A risk solvency assessment therefore looks beyond a single balance sheet or financial result. It considers how future changes could affect the insurer’s ability to pay.
Treat solvency as a continuing ability to meet obligations, not a one-day snapshot.
Own Risk and Solvency Assessment (ORSA) is an internal review of an insurer’s current and prospective risks and its capital sufficiency. The review links risks with financial resources, so leaders can see whether the insurer’s plans remain supportable.
Solvency in insurance does not mean that an insurer will never face losses. It means the company has resources and plans to meet obligations as they arise. A sound assessment also asks how the company would respond if its assumptions no longer held.
We should separate a snapshot from a forecast when reading an assessment. One describes the insurer’s position at a set time; the other tests whether that position could hold up as conditions shift. Treat solvency as a continuing ability to meet obligations, not a one-day snapshot.
Who Regulates Insurance Solvency in the United States?
In the United States, state insurance departments are the primary regulators of insurers operating in their jurisdictions. State authority shapes the rules, while the National Association of Insurance Commissioners (NAIC) helps states coordinate their work.
The NAIC is a nonprofit standards-setting organization governed by chief insurance regulators from all 50 states, the District of Columbia, and five U.S. territories. States retain the power to enact insurance laws and regulations. The NAIC develops model standards, and accreditation helps harmonize oversight without replacing state law.
The NAIC holds three national meetings each year. Its model standards can support consistent rules, but each state decides whether and how to adopt them. Insurers also face laws in every state where they are licensed.
| Main role | Authority | Practical effect |
|---|---|---|
| State insurance departments | Oversee insurers in their jurisdictions | Apply state laws and supervise licensed companies |
| NAIC | Develop model standards and support coordination | Promote more consistent oversight across states |
| Domiciliary state | Regulates the insurer’s legal home | Sets RBC requirements and leads primary supervision |
The 2008 financial crisis showed gaps in group supervision when AIG Financial Products, a London-based non-insurance unit, incurred substantial losses. The Solvency Modernization Initiative followed, and the NAIC introduced U.S. ORSA in November 2011.
The domiciliary state is the state where an insurer is legally based. Its insurance department has a central role, while other states oversee the insurer’s local activities under their laws. For a specific insurer, begin with the insurance department in its domiciliary state and check the laws of every state where it is licensed.
How Do State Capital Rules and RBC Work?
RBC gives regulators a risk-sensitive way to assess whether an insurer holds capital in relation to its exposures. Unlike a flat minimum, risk-based capital (RBC) is a statutory capital measure that relates an insurer’s required capital to the risks it faces.
The domiciliary state sets RBC requirements, while an insurer must also follow laws in other states where it is licensed. Statutory minimum capital varies by state and by the lines of insurance a company writes.
| What it considers | Level of application | Regulatory purpose |
|---|---|---|
| Statutory minimum: state and licensed line | Individual insurer legal entity | Set a baseline capital requirement |
| RBC: asset, insurance, interest-rate, operational, and affiliate risks | Individual insurer legal entity | Relate capital oversight to risk exposure |
| Group-level oversight: shared risks and resources | Insurance group | Add context through group tools |
Insurers must meet statutory minimums and maintain RBC calculated for several types of risk. Regulatory capital is generally assessed at the individual legal-entity level. Group reviews supplement that view through tools such as Form F, ORSA, and group capital calculations.
A group calculation can show risks or support that may affect an insurer, but it does not replace the capital held by each legal entity. Legal entities have their own obligations and may face limits on how they share funds.
The ACLI overview of U.S. solvency regulation describes state oversight and capital tools for life and annuity insurers. Check both the legal entity’s capital position and the group-level information that may affect its support.
Which Risks Belong in a Solvency Assessment?
An insurer’s assessment should cover every material exposure that could weaken its ability to meet policyholder obligations. The mix depends on its products, assets, operations, and plans.
Four commonly used broad insurance risk categories are underwriting, market, credit, and operational risk. Liquidity and other exposures also deserve review, since each can affect the timing or amount of cash available for claims.
Underwriting and insurance risks
Underwriting risk comes from the terms and pricing of insurance business. Claims may occur more often or cost more than expected, or premiums may not match the exposure taken on.
Insurance risk can also reflect shifts in the products an insurer sells or in the people and property it covers. We should consider how claim patterns, policy features, and business growth could alter expected losses.
Market, credit, and liquidity risks
Market risk arises when changes in interest rates, asset prices, or other market conditions affect results. Credit risk is the chance that a borrower or business partner will not pay as agreed.
Liquidity risk concerns the ability to get cash when needed. An insurer may hold assets with value but still face a timing problem if those assets cannot be turned into cash quickly enough to pay claims.
Operational and business-specific risks
Operational risks include process failures, weak controls, system outages, and human error. A broken claims system, for instance, can delay payments and harm policyholders even when the insurer has enough capital.
Other exposures may come from a company’s own structure or strategy. Risks can also interact: a market shock may raise claim costs while reducing asset values. Dividing each risk too narrowly can hide that combined effect.
Our insurance risk assessment methods can help us choose a review approach that fits the exposure. Keep a category for emerging or company-specific exposures instead of forcing every risk into a familiar label.
What Are the Five Steps of a Risk Assessment?
We can make a risk assessment actionable by following five steps from identification through ongoing review. Each step connects a risk with the insurer’s objectives and obligations.
A risk management process should cover both normal and stressed conditions. Listing a risk is not enough; we need to judge its effect and choose a response. We should assign an owner and record the assumptions used.
- Identify the risk and describe how it could affect the insurer.
- Analyze its likelihood and potential impact under normal and stressed conditions.
- Evaluate and prioritize it against the insurer’s objectives and obligations.
- Select a response, such as reducing the exposure or accepting it with controls.
- Monitor results and reassess the risk as conditions or controls change.
For example, a claims team may identify a growing backlog as a risk. The team can estimate the chance of further delays, consider the effect on payments, and rank the issue against other concerns.
The owner should then select an action and track whether it works. A risk that appears minor under normal conditions may deserve more attention if a stress could make it larger or harder to manage.
Documentation helps us understand why a risk received its priority. It also gives later reviewers a way to compare the original assumptions with new evidence. Revisit a risk’s priority whenever its likelihood, potential impact, or mitigation changes.
Which Methods and Metrics Help Assess Risk?
A useful assessment combines methods that fit the risk instead of forcing every exposure into one model. Good fit depends on the insurer’s size, complexity, data, and exposure.
Qualitative review uses informed judgment and clear criteria when reliable numbers are not available. Sensitivity testing changes one input at a time, while stress testing examines a defined adverse change.

Scenario analysis considers a set of connected events, such as falling asset values and rising claims. Risk models use data and assumptions to estimate possible outcomes. Insurers may also use internal control systems to monitor exposure and support ORSA.
Methods should cover normal and stressed environments. A qualitative review can add useful detail when a model cannot measure an exposure well. For example, a new system failure risk may have too little history for a sound loss estimate.
A practical insurance solvency risk assessment template can record the following fields for each material exposure:
- Risk description
- Owner
- Likelihood and impact
- Existing controls
- Stress scenario and capital effect
- Response and review date
The record should state how the team judged likelihood, chose the stress, and estimated the capital effect. Those notes help later reviewers tell whether the risk changed or the method changed.
A complex model is not always better than a clear qualitative review. The method should reflect the decision at hand and the quality of the evidence. Record the assumptions behind each result so a later review can distinguish a changed risk from a changed method.
How Do We Connect Risk to Capital Needs?
A capital assessment becomes useful when it shows how much financial capacity the insurer needs for its material risks and plans. We start by estimating capital for each major exposure.
Then we combine the estimates and test how risks may depend on one another. The resulting need should be compared with available capital, both now and under future conditions. A single-risk estimate may miss the effect of several exposures occurring together.
Estimate capital for material exposures
We can estimate the resources needed to absorb losses tied to each material risk. The method should match the risk and the quality of the information behind the estimate.
Combine risks and test dependencies
After estimating separate exposures, we examine their combined effect. Some risks may rise together, while others may offset one another. We should test those links rather than assume each exposure acts alone.
We also compare the total need with capital that the insurer can use. Group resources may support a company, but they may not be freely transferable to each legal entity.
Link capital decisions to business plans
ORSA connects risk identification, measurement, and priority with capital management and strategic planning. The outlook should include current and prospective risks across a longer business cycle, such as the next 2-5 years.
Growth, acquisitions, dividends, reinsurance, and a shift in business mix can all change capital needs. A plan to enter a new line, for example, may add exposures before the new premiums build up.
Management actions can help bring projected needs and available resources into line:
- Raise capital.
- Slow new business.
- Adjust pricing.
- Change the business mix.
- Arrange reinsurance.
Each action has trade-offs. Reinsurance may reduce some exposures, while changing prices or slowing sales can affect future growth. Test whether a proposed growth or dividend decision still fits the insurer’s projected capital needs.
How Do We Read Solvency Ratios and Margins?
In the U.S. RBC framework, the ratio compares total adjusted capital with authorized control level RBC. The calculation is total adjusted capital ÷ authorized control level RBC × 100%.
The ratio is meaningful only when we know its basis, time period, and regulatory context. A ratio does not show every company-specific exposure, so it cannot serve as a complete verdict on financial strength.
| Basic calculation | What it helps show | Key limitation |
|---|---|---|
| RBC ratio: total adjusted capital ÷ authorized control level RBC × 100% | Capital compared with a regulatory risk measure | Does not capture every company-specific exposure |
| Solvency margin: eligible assets or capital above liabilities or a required level | Financial cushion above the stated measure | Meaning depends on the regulatory framework |
| Capital adequacy assessment: resources compared with assessed risks and needs | Whether resources fit current and future exposures | Depends on assumptions and assessment scope |
A solvency margin generally describes capital or eligible assets in excess of liabilities or a required level. Its exact meaning depends on the regulatory framework and the measure being used.
Capital adequacy is broader than one ratio. It asks whether the insurer’s financial resources can support its risks and plans, including conditions the current measure may not capture.
There is no universal U.S. threshold that makes every RBC ratio a final judgment. Read any ratio alongside its calculation basis and the risks that the measure does not capture.
How Do ERM, Governance, and Controls Support the Assessment?
Strong oversight makes risk and capital information part of decisions rather than a report produced only for compliance. Clear ownership helps leaders act when exposure changes.
The NAIC ORSA framework sets out five ERM principles: risk culture and governance, risk identification and priority, risk appetite and limits, risk management and controls, and risk reporting and communication. An effective ORSA is integrated with enterprise risk management (ERM) and business planning.
Board and senior-management oversight
The board and senior leaders should understand the main risks, capital needs, and planned responses. They need regular reports that show changes, key assumptions, and issues requiring a decision.
One practical way to organize ERM has four layers: strategy, the risk management process, infrastructure, and culture. Together, these layers connect business goals with day-to-day controls and staff behavior.
Risk appetite, tolerances, and limits
Risk appetite describes the amount and types of risk the insurer is willing to take. Tolerances and limits turn that broad position into clear boundaries that teams can monitor.
Each material risk needs an owner who can explain its status and raise concerns. Reporting should show when exposure approaches a limit, not only when it has already passed one.
Controls, reporting, and independent review
Insurance risk control means actions that prevent, reduce, transfer, or monitor exposure. Underwriting rules, reinsurance, and safeguards for claims systems are examples of controls that can limit harm.
We can test whether the control structure works by checking:
- Assigned risk owners
- Documented assumptions
- Data and model validation
- Escalation limits
- Independent review
Control testing should look for gaps between written rules and daily practice. Confirm that a reviewer assessing the ORSA is independent of the work being reviewed.
What Belongs in an ORSA Report?
An ORSA report summarizes an insurer’s risk framework, risk exposures, and prospective capital position. The internal process belongs to the insurer; the ORSA Summary Report is a confidential, high-level report submitted to regulators.
NAIC Model Act #505 became effective January 1, 2015, and became an accreditation standard in 2017. The stated premium thresholds are more than $500 million for an individual insurer and more than $1 billion for an insurance group.
The thresholds use annual direct written and assumed premium. Covered insurers conduct an ORSA at least annually and submit the summary report, though state adoption and regulatory circumstances matter.
Risk management framework
This part describes how the insurer identifies, manages, and reports risk. It shows how governance and controls fit into the company’s wider ERM framework.
Risk exposure assessment
This part explains the insurer’s material risks and how it assesses them under current and prospective conditions. It should show how management understands the exposures that could affect obligations.
Group risk capital and prospective solvency
This part addresses group risk capital and the insurer’s prospective solvency assessment. It connects the group view with the company’s expected capital position and business plans.
The NAIC estimates about 300 ORSA Summary Reports each year, including about 200 group-level reports and 100 single-entity reports. States that adopted the requirement use the NAIC ORSA Guidance Manual as guidance.
The report gives regulators a high-level view, while the insurer’s internal process supports management decisions. Check the applicable state’s adopted requirement before treating a threshold as the only test of whether a filing is required.
How Should We Use Stress Tests and Scenarios?
A stress test asks whether the insurer could withstand a defined adverse change while continuing to meet obligations. It tests resilience, not the likelihood that the exact event will occur.
Stress testing and scenario analysis examine current and future conditions. We should consider both normal and stressed environments across a longer business cycle, such as the next 2-5 years.
Useful scenario categories include:
- Economic downturn
- Severe claims experience
- Market shock
- Credit deterioration
- Liquidity pressure
A single-risk stress changes one exposure, such as a rise in claim costs. A combined scenario brings several events together, such as a market shock alongside higher claims and tighter cash flow.
Combined scenarios matter because risks can interact. A fall in asset values may occur at the same time that the insurer needs cash for claims. Testing only one event at a time may miss that strain.
Results can show where capital needs may rise and which management actions could help. A scenario is not a prediction of actual losses; it is a way to examine how the insurer might respond.
We should record the assumptions and actions built into each test. A result may depend on whether management can raise capital, change business plans, or obtain other support in time.
Record the assumptions and management actions used in each scenario so decision-makers can judge how much resilience depends on them.
When Are U.S. Insurer Financial Filings Due?
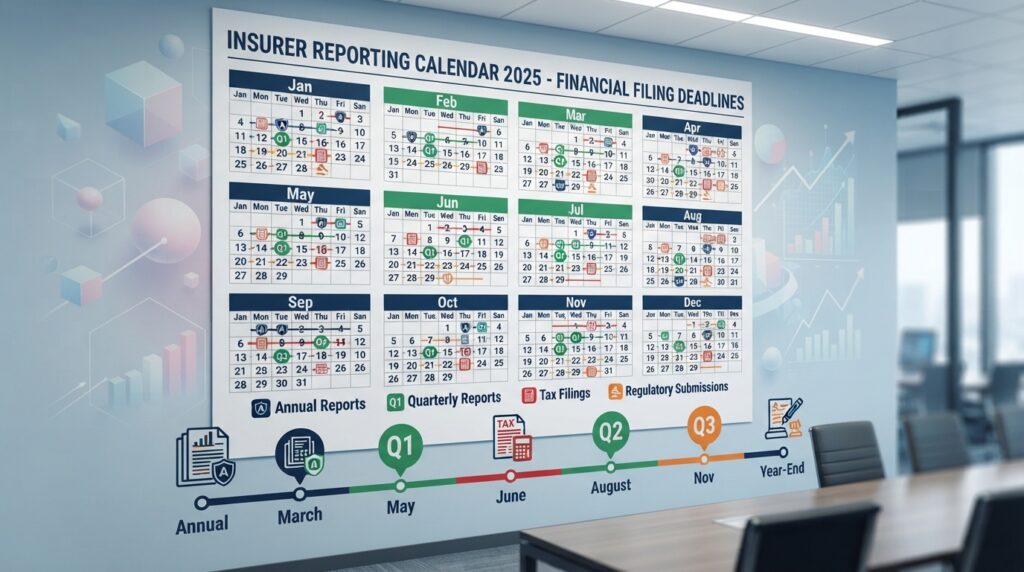
Filing dates are tied to the reporting year and the applicable state requirements, so an example must be labeled by year. For the 2025 data year, the annual financial statement deadline was March 1.
The first-, second-, and third-quarter statement deadlines were May 15, August 15, and November 15, respectively. These dates are a dated example, not a schedule that should be assumed for every year or state.
| Filing | 2025 data-year deadline |
|---|---|
| Annual financial statement | March 1 |
| Quarterly statements: first, second, third quarters | May 15, August 15, November 15 |
| Management’s Discussion and Analysis | April 1 |
| RBC Report and Actuarial Opinion | March 1 |
The audited financial report deadline was June 1. In states that adopted the relevant Model Act, the Corporate Governance Annual Disclosure deadline was also June 1.
ORSA Summary Report and Form F Enterprise Risk Report deadlines vary by state. The calendar should account for the insurer’s state requirements and the filing type, not just the dates listed for common statements.
Each date above applies specifically to the 2025 data year. Filing instructions may also set details for the form, delivery method, and review process. Verify the current deadline and any state-specific filing instructions before scheduling the submission.
What Do Company Rankings Tell Us About Solvency?
The answer depends on the insurance line: the 2025 P&C and life/annuity rankings have different leading companies. Premium volume shows business scale, not whether a company can meet a particular obligation.
There is no single top-three list across all insurance lines. The rankings below measure direct premiums written, not capital adequacy or an insurer’s ability to pay claims.
| Rank | Company | Direct premiums written | Market share |
|---|---|---|---|
| First | State Farm | $115,149,861 | 10.5% |
| Second | Progressive | $84,195,656 | 7.7% |
| Third | Berkshire Hathaway Inc. | $63,597,581 | 5.8% |
The 2025 P&C ranking places State Farm first, Progressive second, and Berkshire Hathaway Inc. third by direct premiums written. Their market shares were 10.5%, 7.7%, and 5.8%, respectively.
| Rank | Company | Direct premiums written | Market share |
|---|---|---|---|
| First | MetLife Inc. | $114,534,965 | 9.3% |
| Second | Equitable Holdings | $95,170,012 | 7.7% |
| Third | New York Life Insurance Group | $76,120,380 | 6.2% |
Among life and annuity writers in 2025, MetLife Inc. ranked first, Equitable Holdings second, and New York Life Insurance Group third. Their market shares were 9.3%, 7.7%, and 6.2%.
Use company size as context, then assess capital and material risks before drawing conclusions about solvency.
A premium ranking can help us understand market presence, but it does not show the risks behind that business. Use company size as context, then assess capital and material risks before drawing conclusions about solvency.
Conclusion
A useful solvency assessment turns financial information into a clear view of what could threaten an insurer and how it would respond. Good decisions connect material risks with available capital, governance, and forward-looking action.
We should use the results to guide choices about growth, pricing, reinsurance, and other plans. The assessment also needs a clear owner and a regular review date, so new conditions do not leave old assumptions in place.
Begin with a current risk inventory and confirm which state requirements apply to the insurer. Start by documenting the insurer’s material risks, current capital position, and next review date.